

Calgary Real Estate Market Trends by Community | 2026 Interactive Map
Calgary’s real estate market is not moving the same way in every neighbourhood. Some communities still have tight inventory and strong buyer demand, while others are seeing more listings, softer conditions, and better opportunities for negotiation.
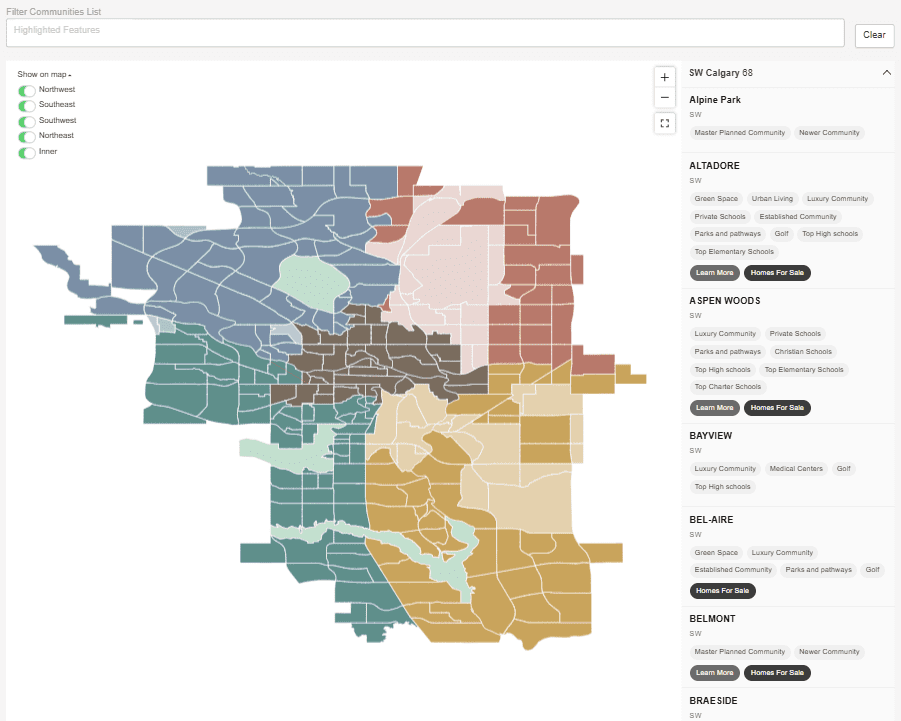
This interactive map helps you explore Calgary real estate market trends by community, so you can see what is happening at a more local level before you buy, sell, or invest.
Instead of relying only on city-wide averages, you can compare community-level data, including benchmark prices, supply shifts, and neighbourhood housing trends.
How to Use the Calgary Housing Market Interactive Map
Use the map to search or select a Calgary community and review the available real estate statistics for that area.
You can use the map to compare:
- Benchmark home prices
- Year-over-year price changes
- Months of supply
- Inventory levels
- Sales activity
- New listings
- Market balance by neighbourhood
These interactive Calgary community real estate statistics can help you understand which areas are still competitive, which are becoming more balanced, and where buyers may have more room to negotiate.
Why Community Level Market Data Matters
Calgary is made up of many different micro-markets. A detached home in one southwest community may be performing very differently from an apartment downtown, a townhome in the southeast, or a newer home on the edge of the city.
That is why looking at Calgary real estate market trends by neighbourhood can give you a clearer picture than broad market headlines alone.
Months of supply, price changes, and inventory levels can all help show whether a community is leaning toward a seller’s market, a balanced market, or a buyer friendly opportunity.
Use the Map as a Starting Point
The map is a helpful starting point, but every property still needs to be evaluated individually. Condition, renovations, lot size, location within the community, basement development, parking, views, and recent comparable sales all affect value.
Use the interactive map below to explore Calgary real estate market trends by community, compare neighbourhoods, and get a clearer picture of how Calgary’s housing market is changing in 2026.
When you are ready to look more closely at a specific community or property, I can help you interpret the numbers and build a strategy around your goals.
Thinking About Buying or Selling in Calgary?
The map gives you a great starting point, but the right strategy depends on your specific home, budget, and community.
Frequently Asked Questions
What does Calgary real estate market trends by community mean?
It means looking at housing data for individual Calgary neighbourhoods instead of only using city-wide averages.
Why does neighbourhood-level real estate data matter?
Calgary communities can perform very differently depending on property type, price range, inventory, and buyer demand.
What is months of supply?
Months of supply estimates how long it would take to sell the current listings if no new homes came on the market. Lower supply usually means stronger seller conditions, while higher supply can mean more choice for buyers.
How can buyers use the interactive map?
Buyers can compare communities, review price trends, and identify areas where competition may be stronger or softer.
How can sellers use the map?
Sellers can use the map to better understand local competition and choose a pricing strategy based on their specific neighbourhood.