

Safest Areas to Live in Calgary Based on the Latest Calgary Police Service Crime Statistics
When families search for Calgary’s safest neighbourhoods, they’re usually looking for more than a crime chart. They want a community that feels calm, well kept, family friendly, and comfortable for everyday life.
The good news is that Calgary continues to compare well nationally. In the Calgary Police Service 2025 Crime Severity Index report, Calgary’s CSI was 63.3, which the report says is a continued decline since 2022 and well below the Canadian national average. The same report notes that the CSI is different from a simple crime count because it weights offences by seriousness rather than treating every incident equally.
That citywide context matters. It suggests that, overall, Calgary remains a relatively strong market for families who want both lifestyle and peace of mind. But when you drill down to the community level, it is still helpful to look at which neighbourhoods are posting lower reported crime totals.
What crime data does the Calgary Police Service publish?
The Calgary Police Service publishes several types of public crime statistics to help residents better understand crime trends across the city. These datasets are part of the Service’s transparency and accountability initiatives and are updated regularly so the public can review crime patterns in their communities.
One of the most widely used tools is the Community Safety Dashboard, an interactive map that allows residents to explore reported incidents by community, district, or city ward. The dashboard is updated monthly (typically on the fifth day of each month) and helps users compare crime trends over time and view geographic patterns across Calgary.
In addition to the dashboard, the Calgary Police Service also publishes Monthly Community Crime and Disorder Statistics, Quarterly Statistical reports and Crime Severity index reports. An important qualification is that these reports provide raw community count data, not a per capita rating. This means that the count does not correct for the size or number of people in a community. They provide useful context for communities that appear to be quieter on police reported data.
Calgary Crime Trends relative to Canada
When looking at neighbourhood safety, it’s helpful to step back and look at citywide crime trends over time. The Calgary Police Service publishes annual reports using the Crime Severity Index (CSI), a metric developed by Statistics Canada that measures both the volume and seriousness of crime.
Based on recent Calgary Police Service reports, Calgary’s overall Crime Severity Index has declined since 2022, suggesting that crime severity across the city has been trending downward in recent years. The city’s CSI has also remained below the Canadian national average, which is often reassuring for families comparing major Canadian cities.
Top 50 Safest Communities grouped visually by quadrant
| Community | Quadrant | Crime Rate /1000 |
|---|---|---|
| Hamptons | NW | 3 |
| Kincora | NW | 3 |
| Citadel | NW | 4 |
| Rocky Ridge | NW | 4 |
| Edgemont | NW | 5 |
| Royal Oak | NW | 5 |
| Hidden Valley | NW | 6 |
| Nolan Hill | NW | 6 |
| Tuscany | NW | 6 |
| Silver Springs | NW | 7 |
| Scenic Acres | NW | 9 |
| Varsity | NW | 10 |
| Sage Hill | NW | 12 |
| Sherwood | NW | 8 |
| Harvest Hills | NW | 11 |
| Panorama Hills | NW | 7 |
| Evergreen | SW | 5 |
| Bridlewood | SW | 6 |
| Aspen Woods | SW | 7 |
| Braeside | SW | 8 |
| Somerset | SW | 8 |
| Cedarbrae | SW | 8 |
| Canyon Meadows | SW | 14 |
| Altadore | SW | 15 |
| Glamorgan | SW | 17 |
| Mount Pleasant | SW | 17 |
| Glenbrook | SW | 20 |
| Bankview | SW | 30 |
| Auburn Bay | SE | 6 |
| Cranston | SE | 6 |
| New Brighton | SE | 6 |
| McKenzie Lake | SE | 5 |
| Copperfield | SE | 5 |
| Riverbend | SE | 9 |
| McKenzie Towne | SE | 9 |
| Mahogany | SE | 10 |
| Taradale | SE | 10 |
| Lake Bonavista | SE | 13 |
| Acadia | SE | 18 |
| Abbeydale | NE | 7 |
| Applewood Park | NE | 5 |
| Castleridge | NE | 10 |
| Whitehorn | NE | 12 |
| Skyview Ranch | NE | 12 |
| Martindale | NE | 14 |
| Falconridge | NE | 19 |
| Saddle Ridge | NE | 21 |
| Pineridge | NE | 22 |
Quick Insights
- Highest concentration of very low crime rate communities
- Many large master planned suburban areas
- Wider range of crime rates due to inner-city + suburban mix
- Consistently low to moderate crime rates
- Many newer communities
- Greater variation depending on density and housing mix
the safety of Calgary’s downtown is a tale of two different realities: a statistically safer city overall, but one with highly visible pockets of social disorder that affect public perception. These issues are most pronounced in the East Village and near the Sheldon M. Chumir Health Centre, where essential social services and vulnerable populations are concentrated.
Safest Communities based on Crime Data
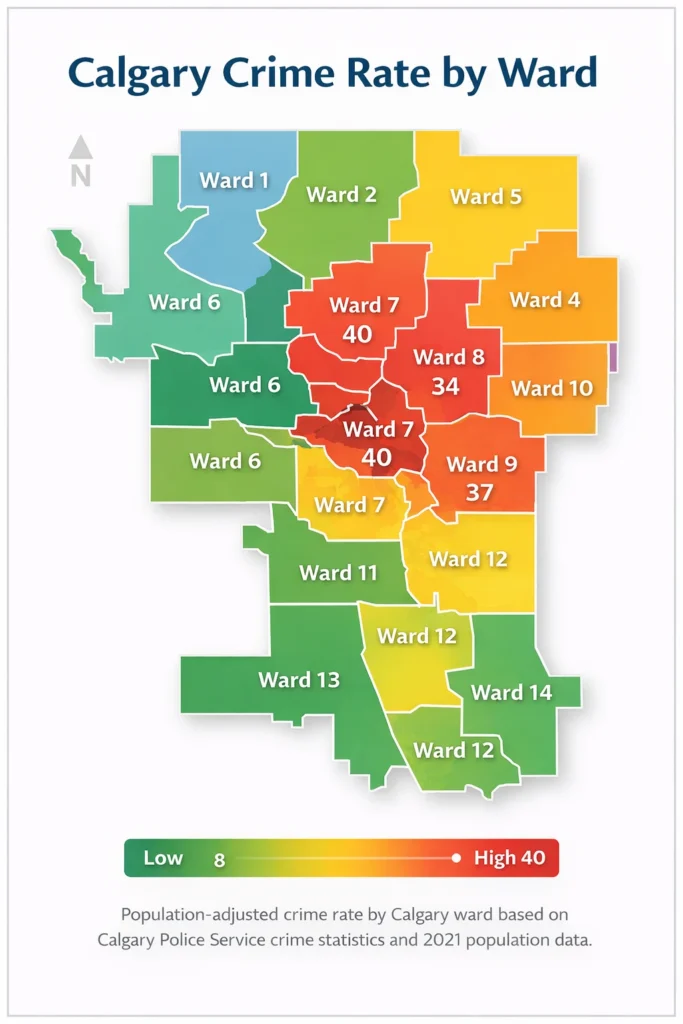
The map below highlights some of the safest areas to live in Calgary based on population-adjusted crime rates using Calgary Police Service data.
Calgary Communities by ward
| Ward | Communities |
|---|---|
| Ward 1 (NW) | Bowness, Montgomery, Greenwood/Greenbriar, Valley Ridge, Tuscany |
| Ward 2 (NW) | Rocky Ridge, Royal Oak, Citadel, Arbour Lake, Hawkwood |
| Ward 3 (NW) | Evanston, Sage Hill, Nolan Hill, Kincora, Hidden Valley, Country Hills |
| Ward 4 (NW / Inner NW) | Varsity, Brentwood, Charleswood, Collingwood, Highland Park, Rosemont |
| Ward 5 (NE) | Saddle Ridge, Martindale, Taradale, Cornerstone, Redstone |
| Ward 6 (SW) | Signal Hill, Aspen Woods, West Springs, Cougar Ridge, Springbank Hill, Christie Park, Coach Hill, Patterson |
| Ward 7 (Inner City) | Hillhurst, Sunnyside, Kensington, Banff Trail, Capitol Hill |
| Ward 8 (Inner SW) | Altadore, Garrison Woods, Richmond, Killarney, Bankview |
| Ward 9 (SE / Inner East) | Forest Lawn, Albert Park/Radisson Heights, Dover, Southview |
| Ward 10 (NE / East) | Pineridge, Rundle, Whitehorn, Marlborough, Marlborough Park |
| Ward 11 (SW) | Lakeview, Glendale, Glamorgan, Kelvin Grove, Oakridge, Haysboro |
| Ward 12 (SE) | Auburn Bay, Mahogany, Cranston, McKenzie Lake, McKenzie Towne, Seton |
| Ward 13 (SW) | Evergreen, Bridlewood, Somerset, Shawnessy, Silverado |
| Ward 14 (SE / Fish Creek) | Deer Run, Deer Ridge, Queensland, Parkland, Midnapore, Sundance |
Calgary Communities With Lower Population Adjusted Crime Rates
To better understand safety across Calgary, it helps to look at crime relative to population size. Population adjusted crime rates show how many incidents occur per 1,000 residents, which provides a clearer comparison between communities of different sizes.
Based on Calgary Police Service community crime statistics and population estimates, the communities shown below have some of the lower crime rates in the city.
Northwest Calgary
- Scenic Acres
- Silver Springs
- Arbour Lake
- Edgemont
- Brentwood
- Varsity
Southwest Calgary
Inner City Residential Communities
- Garrison Green
- Charleswood
- Mount Royal
These neighbourhoods share several characteristics that often contribute to lower incident rates, including strong community engagement, residential zoning, and limited through traffic.
Final Thoughts
Choosing where to live in Calgary involves many factors, and safety is just one part of the picture.
By combining Calgary Police Service crime statistics with community population data, we can gain a clearer understanding of how neighbourhoods compare while still recognizing that crime statistics are only one indicator of community well being.
For families moving to Calgary, many neighbourhoods across the city offer strong community environments, great schools, and access to parks and amenities.
Taking the time to explore communities in person, talk with residents, and consider lifestyle factors will ultimately provide the best insight into which neighbourhood feels like the right fit.
Frequently Asked Questions
Some of the safest areas to live in Calgary are typically found in established residential communities in West and South Calgary. Neighbourhoods such as Discovery Ridge, Cougar Ridge, West Springs, Parkland, and Chaparral often show lower population adjusted crime rates compared to denser urban areas. However, safety can vary within any community and is influenced by factors such as population density, commercial activity, and traffic patterns.
Crime rates are commonly measured using the number of incidents per 1,000 residents. This method adjusts for population size so that smaller communities can be compared more fairly with larger neighbourhoods. The data used on this page is based on Calgary Police Service community crime statistics combined with community population estimates.
Not necessarily. Newer suburban communities sometimes have lower reported crime rates because they are primarily residential and have fewer commercial areas or nightlife activity. Older communities may show higher numbers simply because they have more businesses, transit access, and population density.
Based on population adjusted crime statistics, many communities in North West and South West Quadrants of Calgary tend to show lower crime rates. These areas are often primarily residential with fewer commercial zones. However, Calgary is generally considered a safe city overall, and many communities across the city offer a strong quality of life.
Communities with higher crime rates often have characteristics such as higher population density, commercial areas, transit hubs, nightlife, or shopping districts. Downtown and inner city areas may have more reported incidents simply because more people travel through those neighbourhoods each day.
Not necessarily. Crime statistics provide useful context but do not tell the whole story about a neighbourhood. Many areas with higher incident counts still offer excellent amenities, strong community involvement, and desirable housing options.
Official community crime statistics are published by the Calgary Police Service. Their website provides detailed data on crime incidents by community and year, along with reports explaining crime trends across the city.
Safety is important, but other factors also play a big role when choosing where to live. Many people consider schools, commute times, parks and recreation, access to transit, nearby shopping, and overall community lifestyle when selecting a Calgary neighbourhood.
Yes. Calgary consistently ranks as one of the safer large cities in Canada. Like any growing city, crime levels can vary between neighbourhoods, but most communities provide a safe and family friendly environment.
The Calgary Police Service regularly publishes updated community crime statistics that show the number of incidents reported in each neighbourhood. These reports are typically updated monthly and annually, allowing residents to track trends and changes in crime levels across Calgary communities.
Community crime statistics generally include a range of reported incidents such as property crime, vehicle theft, break ins, and other police reported offences. The data provides an overview of overall crime activity in each community rather than focusing on only one type of incident.
Yes, crime rates can change over time due to factors such as population growth, policing initiatives, community programs, and economic conditions. Looking at trends over several years can provide a better understanding of how safety is evolving in different Calgary neighbourhoods.
Beyond reviewing crime statistics, it can be helpful to work with a local realtor for recommendations. They can help you explore neighbourhood amenities, schools, parks, commute times, and local community associations. Visiting the area, speaking with residents, and reviewing local resources can provide a more complete picture of what living in that community is like.